


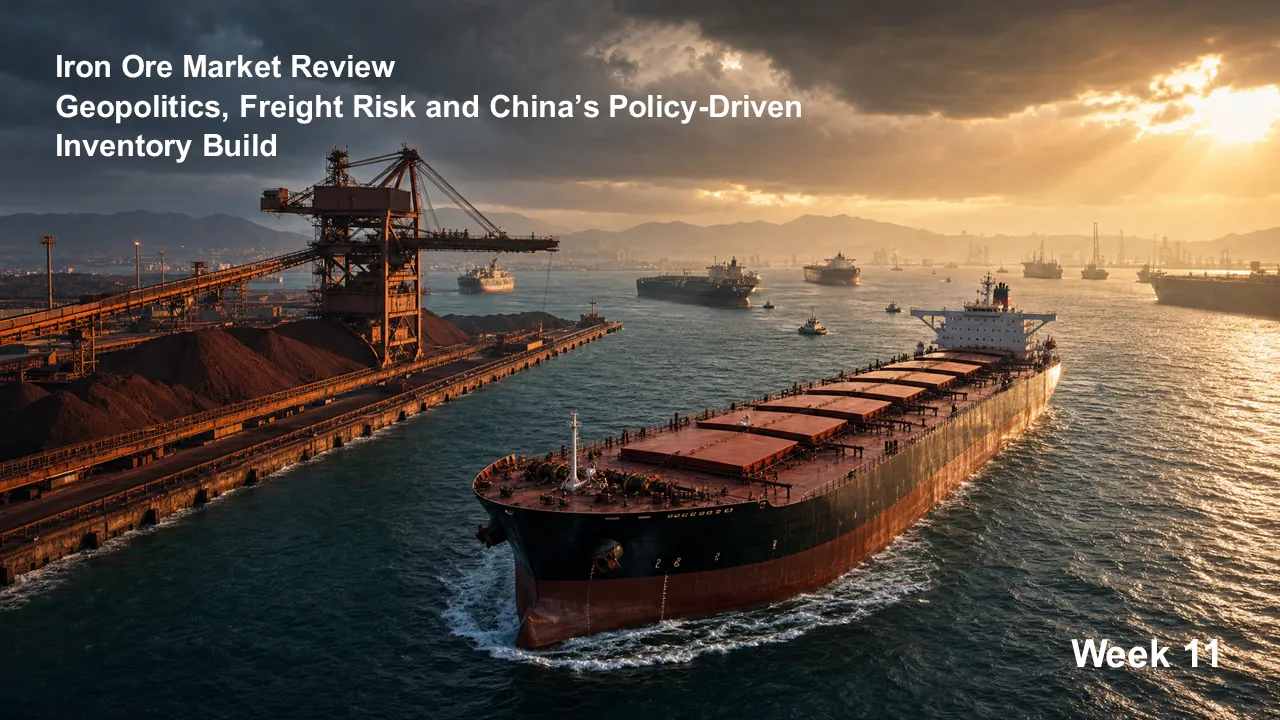
Geopolitical tensions are feeding into higher energy costs and sharper freight volatility, at a time when Chinese steel demand remains weak and iron ore inventories stay high. Mining and shipping are energy intensive, so higher oil prices lift costs across extraction, processing, inland transport and seaborne legs, and bunker volatility is now a key transmission channel.
In Singapore, bunker distributors have reduced large purchasing commitments amid extreme price swings, delaying orders and managing inventories more cautiously even as overall supply remains relatively adequate. Shipping data shows Chinese iron ore arrivals softened into early March after strong flows earlier in the year, partly reflecting normalisation and temporary loading disruptions in Australia and Brazil during February.
The early year strength is framed as policy driven stockpiling, with mills building inventories ahead of the steel export quota system introduced in January, masking weak underlying steel demand.
Capesize average earnings were $26,100/day with the BCI up 9.5% w o w to 2,880. Panamax average earnings were $16,550/day with the BPI down 6% w o w to 1,838. Supramax average earnings were $16,200/day with the BSI down 7.5% w o w to 1,283. Handysize average earnings were $14,330/day with the BHI down 4% w o w to 796.
Capesize improved through the week on Brazil and West Africa to China, with C3 assessed close to $30/ton and a 180,200 dwt fixed via Brazil with West Africa option to Qingdao at $27.40/ton.
Panamax remained under pressure as prompt tonnage built and fronthaul and transatlantic enquiry stayed limited, with an 81,700 dwt fixed delivery EC South America for redelivery Skaw Gibraltar at $26,000/day.
Supramax faced growing pressure in the US Gulf and South Atlantic on thin cargo flow and a longer tonnage list, with a 61,000 dwt placed on subjects for a trip delivery Rio de Janeiro to the US Gulf at $18,000/day.
Handysize softened in the South Atlantic and US Gulf as tonnage built against limited fresh demand, with a 37,000 dwt fixed from Recalada to the Mediterranean at $21,500/day.
Capesize ended firmer on healthy miner presence, with C5 assessed at $9.60/ton and a 178,000 dwt fixed Port Hedland to Qingdao at $10.25/ton.
Panamax demand from Indonesia and Australia stayed present but fixing slowed on volatile bunker prices and wider bid offer gaps, with an 81,600 dwt fixed delivery Cebu for redelivery South China at $23,000/day via East Coast Australia.
Supramax activity stayed cautious, with a 56,000 dwt open Lianyungang fixed for a trip to West Africa at $18,000/day.
Handysize began firmer before momentum faded, with a 40,000 dwt open Singapore fixed for multiple legs at $17,500/day.
VLCC corrected lower, with TD15 West Africa to China easing to $115,100/day as fixing slowed and more owners stepped back from regional exposure.
Suezmax softened, with TD20 Nigeria to UK Continent down to $119,500/day and TD27 Guyana to UK Continent easing to $127,900/day on softer sentiment and expectations of more eastern ballasters.
Aframax lost ground, with TD25 US Gulf to UK Continent down to $55,500/day and TD26 East Coast Mexico to US Gulf down to $76,500/day.
LR2 TC20 MEG to UK Continent eased to $83,200/day but remained elevated.
MR softened, with TC21 US Gulf to Caribs down to $93,800/day and TC2 ARA to US Atlantic Coast easing to $17,800/day.
VLCC remained the strongest benchmark despite correction, with TD3C MEG to China at $411,400/day as uncertainty around AG loadings continued to distort normal patterns.
Suezmax stayed elevated East of Suez and remained highly sensitive to changes in Red Sea and Gulf trading conditions.
Aframax TD19 cross Med softened to $125,500/day, though activity improved later in the week and a tighter list lifted confidence into the close.
LR2 TC1 MEG to Japan fell to $77,500/day and LR1 TC5 eased to $53,000/day, with pricing shaped by limited AG trading, redirected Yanbu flows and volatile bunker costs.
MR TC7 Singapore to East Coast Australia softened to $16,500/day, with earnings lower despite still active cargo interest in selected regions.
Over the past twelve months, Greek interests remained the leading sellers with 305 vessels sold across sectors, versus 137 sales by Chinese sellers. Greek selling was led by 145 dry bulk and 117 tankers, plus 32 containers and 5 gas carriers, while Chinese selling comprised 87 dry bulk, 33 tankers, 10 containers and 5 gas carriers. On the buying side, China ranked first with 212 purchases and Greece followed with 198, with Chinese buying led by 161 dry bulk and 40 tankers and Greek buying led by 110 dry bulk and 63 tankers, alongside 19 container acquisitions.
This post provides a high-level view of iron ore market developments, freight volatility, and China’s inventory-driven trade dynamics.
The full Allied QuantumSea Weekly Market Report – Week 11 includes:
· In-depth iron ore market analysis covering China inventories, steel demand & policy effects
· Geopolitical impact assessment on bunker costs, freight volatility & commodity flows
· Detailed dry bulk and tanker earnings tables across all vessel classes
· Atlantic & Pacific route-level freight coverage with fixture benchmarks
· Bunker market developments and cost transmission across shipping routes
· Baltic indices, TCE calculations & historical trend comparisons
· Secondhand S&P transactions, buyer–seller positioning & asset value trends
· Recycling activity and scrap pricing indicators
👉 Fill in the form below to subscribe and receive the complete PDF directly in your inbox every week.