


EDITORIAL REVIEW NOTE — The supplied LinkedIn draft is labelled Week 45, while the authoritative market report is Week 44. Although both address the Strait of Hormuz and share headline figures, they are not the same reporting week. This Week 44 draft therefore uses the Week 44 PDF alone for its research angle and all market data. Confirm the correct LinkedIn post before publication.
Capesize strength lifted dry bulk despite declines across the smaller classes: the Baltic Dry Index gained 2.0% to 2,714, while Capesize TCE earnings advanced 9.8%. Tanker performance was less uniform. VLCC earnings rose even as the Baltic Dirty Tanker Index slipped 2.1% to 7,019 and the Clean Tanker Index fell 5.4% to 2,850. Secondhand buying remained active in geared bulkers and especially MR tankers, against a freight market still distorted by restricted access to the Arabian Gulf.
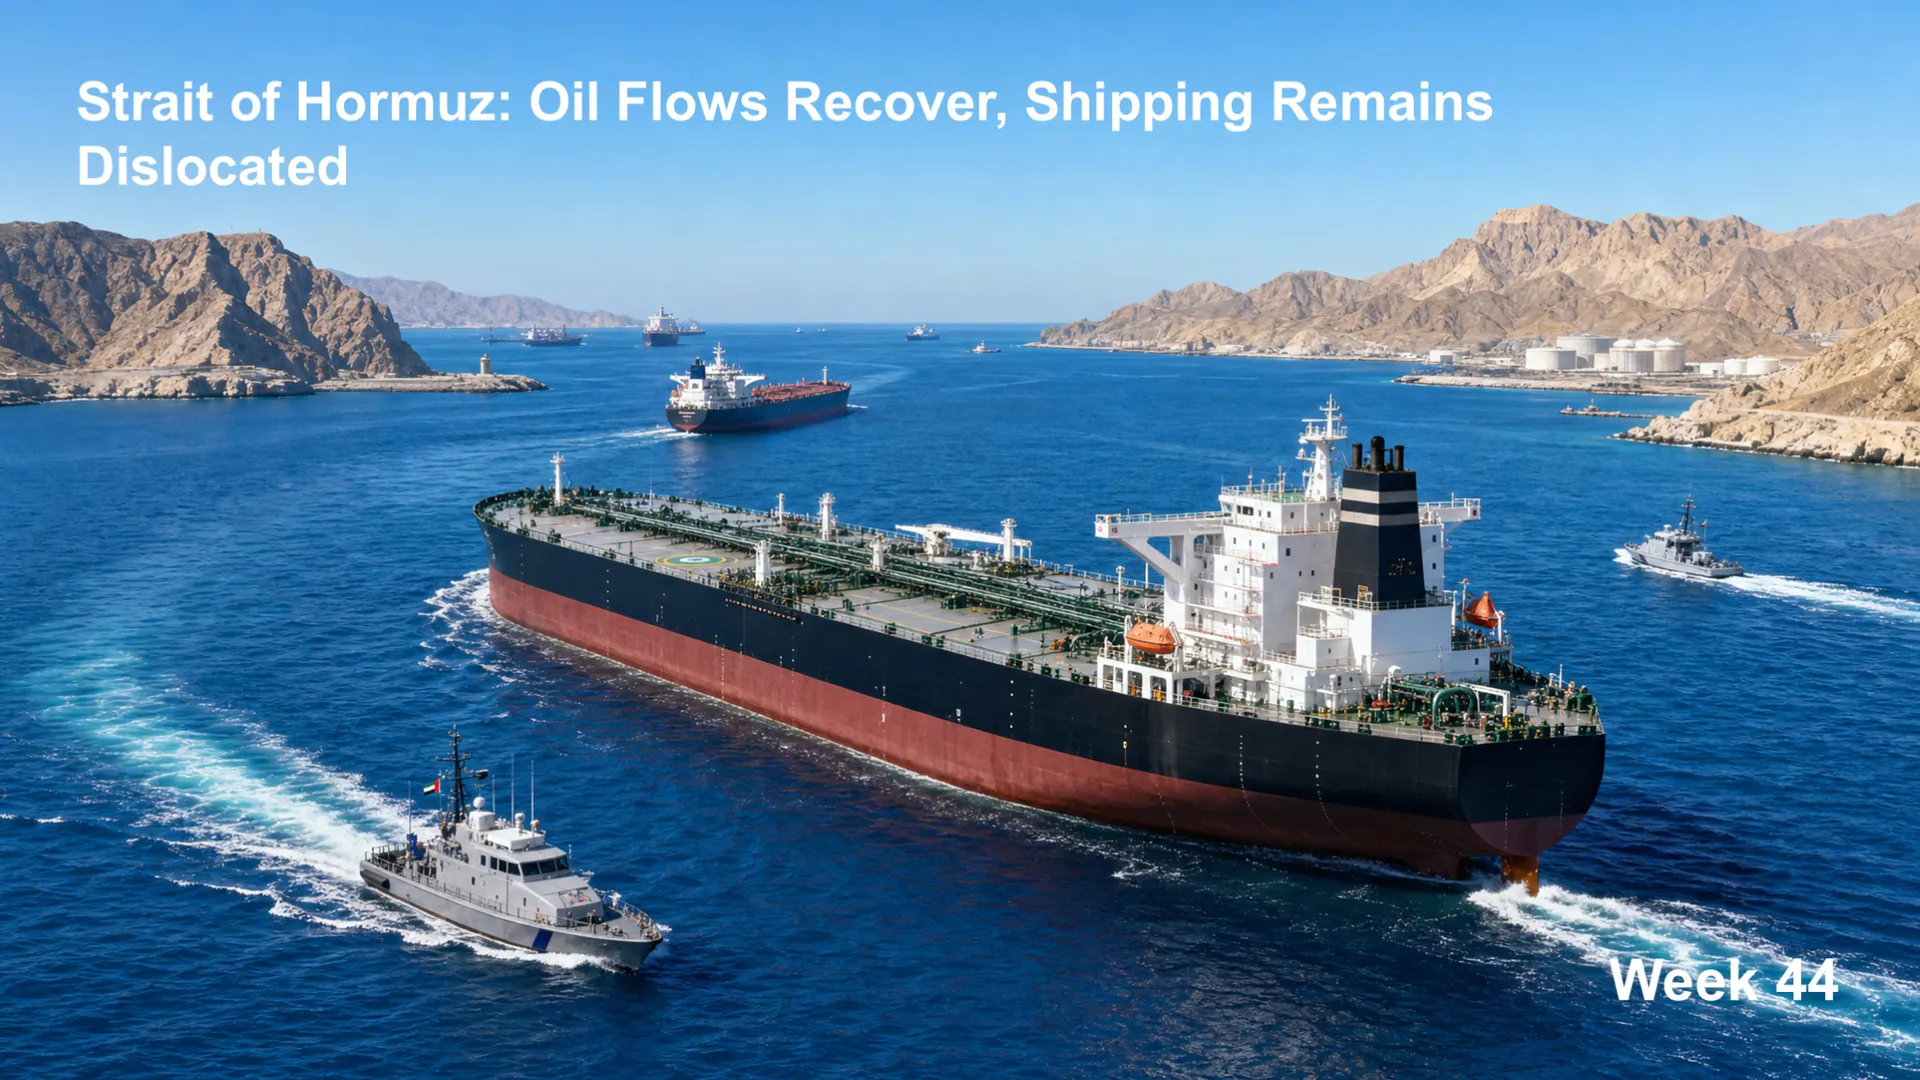
Estimated oil movements through the Strait of Hormuz reached 11.7 million barrels per day in October, up from 9.8 million in September, but still approximately 19% below the 14.5 million barrels/day pre-conflict reference. Recovery in cargo volumes has not restored normal access: a snapshot for 1 November identified only eight confirmed crossings, four inbound and four outbound, including three reconstructed dark passages.
Tracking uncertainty is material. Seven dark transits were identified over 30 October–1 November, five after multi-day AIS gaps that prevent precise crossing times. GPS-jammed vessels in the monitored Arabian Gulf and Gulf of Oman zone increased from 170 on 29 October to 754 on 31 October, then eased to 478 on 1 November. A separate August review found 393 of 642 logged crossings were false AIS-derived transits; these positioning anomalies should not be treated as physical movements or cargo transfers.
Security restrictions continue to shape freight through owner acceptance, insurance, crew and port-service constraints. At least four tanker attacks were reported on 29–30 October. Middle East VLCC tonne-miles and tonne-days were down 34% and 24% year on year, respectively, while an estimated 80 VLCCs operated in the Gulf of Oman shuttle fleet. On 30 October, assessed AG–China VLCC earnings of approximately $1.35 million/day compared with approximately $699,000/day from the Gulf of Oman to China. Different route exposure and restricted accessible tonnage, rather than oil demand alone, help explain the gap; these are research assessments, not reported fixtures.
The BCI climbed 8.8% to 4,126 and Capesize TCE earnings rose 9.8% to $33,917/day. Atlantic routes led: C2 Tubarao–Rotterdam gained 12% and C3 Tubarao–Qingdao 9%. The CHANG SHOU STAR reportedly fixed 170,000 tonnes Tubarao/optional West Africa–Qingdao for 1–7 December at $36.60/tonne fio. Pacific C5 West Australia–Qingdao gained 6% over the week, although its Friday assessment slipped $0.225 to $14.880/tonne amid miner bidding and owner resistance.
The BPI and Panamax TCE each declined 10.4%, to 1,889 and $16,999/day. Limited transatlantic grain enquiry and an ample North Continent list weighed on Atlantic rounds, which fell 20%; US Gulf fronthaul enquiry improved without lifting rates. In the Pacific, slower east Australian and North Pacific activity and limited Indonesian coal employment pressured sentiment. The KERYRA (81,375 dwt) fixed Shanghai via NoPac to Fujairah with grain at $19,250/day, while P5 China–Hong Kong declined 11%.
The BSI eased 1.2% to 1,865 and Supramax TCE fell 1.3% to $21,535/day. US Gulf petcoke and grain business still produced strong individual fixtures: the ACHI (63,301 dwt) fixed mid-November US Gulf to India with petcoke at $32,000/day, while the PAN QUEST (63,245 dwt) fixed US Gulf via Cape of Good Hope to China with grain at $28,500/day. Pacific rounds were flat; S4A US Gulf–Skaw declined 3%.
Handysize TCE eased 0.6% to $18,255/day and the BHSI fell 0.6% to 1,014. Excess US Gulf supply pushed the 4_38 US Gulf–Skaw route down 6%, although the SAINT VASSILIOS (33,889 dwt) fixed Fortaleza via Pecem to Bremen at $27,000/day. Pacific rounds (6_38) gained 1%, while the 5_38 Southeast Asia–Australia/Japan route was unchanged.
VLCC TCE advanced 8.9% to $829,398/day despite a 2.1% decline in the broader BDTI. Fujairah fixtures were around WS550 early in the week; stronger Fujairah and Yanbu enquiry subsequently reduced prompt availability. The 28 October Middle East Gulf list counted 86 VLCCs available over the next 30 days. West African availability also tightened as ships moved elsewhere: TD15 West Africa–China gained 17%, TD22 US Gulf–China 12% and TD3C Middle East Gulf–China 4%.
Suezmax TCE declined 10.7% to $570,090/day. West African charterers faced less fresh enquiry, with one cargo drawing nine offers on 28 October, even though unrestricted forward tonnage remained limited. Fujairah enquiry continued and some owners ballasted towards West Africa. WAF–UK Continent stood at WS715; TD6 Black Sea–Mediterranean lost 14% and TD20 West Africa–UK Continent 4%.
Aframax TCE fell 9.8% to $303,147/day. A cross-Mediterranean fixture at WS797.5 preceded Libya business at WS725 and WS710 as unfixed ships accumulated; TD19 Mediterranean rounds dropped 23%. In the East, Indonesia/up was assessed at 80,000 tonnes × WS670 amid limited demand and available tonnage, while TD14 Southeast Asia–Australia fell 13%. North Sea local rates were around WS570, with weather temporarily limiting ballast arrivals.
An LR2 75,000-tonne naphtha STS Sohar–Japan cargo fixed at WS450 on TC1 after a slower fixing week. A 90,000-tonne jet STS Sohar–UK Continent movement via the Cape was paid $12 million, while a comparable 90,000-tonne ULSD Yanbu–UK Continent move was indicated around $14 million. LR1 55,000-tonne Sohar–Japan naphtha traded near WS500 versus WS535 early in the week. Only two LR2s featured among 24 Western naphtha cargoes to Asia in October, compared with 21 MRs, reflecting constrained arbitrage economics.
The Atlantic MR earnings basket gained 5.3% to $82,052/day, while the Pacific basket declined 6.7% to $75,871/day. Tight lists supported West Coast India, with TC17 at WS570, but TC11 South Korea–Singapore lost 13% and TC7 Singapore–Australia 6%. In the Atlantic, UK Continent–West Africa stood at WS325, UK Continent–Brazil at WS320 and a 37,000-tonne cross-Mediterranean naphtha stem fixed at WS405. TC14 US Gulf–Continent gained 8%.
Weekly dry bulk sales held at 16 priced vessels, with reported capital exceeding $314.95 million. Supramax/Ultramax led with five sales, followed by four Handysize, three Capesize, three Panamax/Kamsarmax and one Post-Panamax. Greek buyers were reported for the WILLIAM OLDENDORFF (179,120 dwt, 2017) at $49 million and INDUS TRIUMPH (92,967 dwt, 2012) at $16.6 million; Chinese buyers took LADYCHARM (169,676 dwt, 2008) at $27 million. The PAN ADVANCE (179,185 dwt, 2009) was reported sold at $35.3 million, illustrating firmer older Capesize values.
Tankers recorded 17 weekly sales, 16 priced, with at least $739.7 million reported invested. MR dominated with 12 units, including eight newbuilding or near-newbuilding vessels; there was also one VLCC, one Suezmax, one Aframax/LR2 and two product/chemical vessels. Greek interests acquired HAIMA (104,991 dwt, 2009) for $65 million; the Suezmax FLEVES (158,517 dwt, 2012) was reported sold for $110 million. Chinese buyers acquired LONG DA 07 (13,800 dwt, 2026) for $28.5 million, while Indonesian buyers took SEA CRYSTAL (17,602 dwt, 2010) for more than $12 million. Four Chengxi-built MR units were reported at $55 million each. These weekly counts are reported sales, not a count inferred from selected transaction examples.
As of the report’s 30 October 2026 data cutoff, the 2026 secondhand table records 1,483 vessel sales totalling 125,877,436 dwt: 644 dry bulk, 573 tankers, 137 container ships, 60 gas carriers and 69 other vessels. Dry bulk included 248 Supra/Ultramax, 144 Handysize, 140 Pana/Kamsarmax, 64 Capesize/VLOC, 46 Post-Panamax and two small bulkers. Tankers included 176 MR, 125 VLCC, 84 small tankers, 72 Suezmax/LR3, 70 Aframax/LR2 and 46 Panamax/LR1. The dry-bulk commentary separately says 249 Supra/Ultramax YTD, versus 248 in the consolidated table; this draft follows the consolidated YTD table pending editorial confirmation.
The nationality statistics cover the past twelve months, not 2026 YTD. Greek buyers accounted for 241 vessels (111 dry bulk and 101 tankers), against 223 for Chinese buyers (172 dry bulk and 36 tankers). On the selling side, Greece recorded 320 vessels and China 169 over the same rolling period.
This roundup examines how the recovery in Hormuz oil flows coexists with restricted tanker access, divergent freight trends and active secondhand markets.
The full Allied QuantumSea Weekly Market Report – Week 44 includes:
· Hormuz oil-flow comparisons, crossing observations and security developments
· AIS/GPS interference, Gulf fleet composition and tanker capacity implications
· Dry bulk and tanker indices, route movements, earnings and reported fixtures
· Secondhand vessel transactions, indicative asset prices and 2026 sector/size activity
· Past-twelve-month buyer and seller nationality data
· Newbuilding orders, prices and ship-recycling market information
👉 Fill in the form below to subscribe and receive the complete PDF directly in your inbox every week.